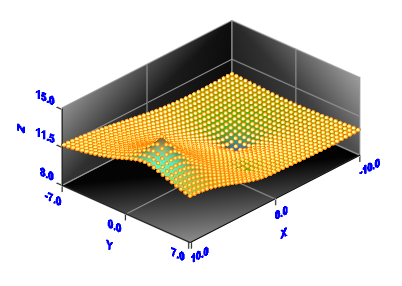
If a surface is defined by M*N points, or volume is defined by M*N*H points, here M is the number of rows in x direction, N is the number of rows in y direction and H is the number of rows in z direction, then the data are called regular data. For example, the following figure shows a surface defined by 41*29 points. The data here are regular. |
||
Download Visual Data today and start creating stunning scientific visualizations for your research and analysis.